Using Vector Search to See Signals in Company News
How we use vector search to extract investment signals from a multi-terabyte company news dataset that currently contains over 55 million embeddings, 150+ million sentences, 4+ billion words, and 5+ billion GPT tokens.


The more things change, the more they stay the same. Every year we set ourselves an impossible goal. That has not changed. What has is that we will be building towards that goal publicly. So, we invite you to follow us on this journey and learn alongside us as we tackle a problem of epic proportions.
What's the goal? Good question! Our goal is to build a system capable of extracting signals from internet-scale datasets comprised of billions of vectors. When fully realized this system would resemble Google Trends except that it would be more open and finetuned for the investment industry.
In this blog post we will take a step back and discuss our 2023 goal. That goal was to curate a high-quality news dataset for all companies and extract investment signals from it. That was a steppingstone to where we are now. The impressive results we achieved are what have inspired us to kick it up a notch.
Table of Contents
- Introduction
- Dataset
- Infrastructure Setup
- Company Names
- Inline Headlines
- AI-Generated News
- De-duplicating News
- Semantic Search
- Locality Sensitive Hashing
- Signals
- Verification Signals
- Market Signals
- Applications
- Next Steps
Introduction
Signals are time series that help us make decisions. The quick and dirty way to measure how informative a signal is, is to look at the difference between the performance of your decisions with that signal versus the performance without that signal. In other words, G(Decisions|Signal) - G(Decisions). Where G is an objective measure of performance (a.k.a. the hard part).
Signals are usually distilled from larger datasets. These datasets can either be structured or unstructured. For example, NewMark Risk extracts signals from options data (structured). S3 Partners is another example, they extract short interest signals from treasury flows (structured). SwaggyStocks, on the other hand, extracts signals from Reddit comments (unstructured).
It is fair to think that because structured data is more available and exhaustively mined by the community, alpha is harder to find and harder to keep secret. For this reason, and because it aligned with our 2023 roadmap, we decided to invest in unstructured data - company news. Given the recent advances in large language models I thought the task would be a little "easier".
I was wrong. Take it from me, unstructured data is still a pain in the *ss.
Dataset
The largest part of our goal for 2023 was to collect and enrich a corpus of verified company news from around the world. We achieved that goal, but as you will see the journey wasn't easy. At the time of writing, our corpus is a multi-terabyte text and embeddings dataset which contains over 55 million embedded snippets, 150+ million sentences, 4+ billion words, and 5+ billion GPT tokens.
For those interested, this dataset is available to all users through various features in our core product as well as via API for enterprise customers.
More challengingly, the corpus is growing. We add 300,000 new snippets a day and are expanding our coverage of historical news to delisted companies. Adding to a dataset this size whilst maintaining quality and keeping the runtime of our API endpoints under 1 second is difficult. But the data itself was much harder. In no particular order, here are a few of the problems we faced:
- Resolving news between companies with nearly identical names.
- Stripping out inline headings from inside the body of news stories.
- Identifying and filtering out the torrent of AI-generated fake news.
- De-duplicating identical news stories across publishers and time.
- Approximate nearest neighbors at scale with arbitrary filtering.
Because I know you're curious, I'll elaborate a little on each 👀.
Infrastructure Setup
But first, it is worth mentioning our data infrastructure.
Our ETL system runs across 15 OVH servers in different regions. Each worker is running an API (FastAPI + Gunicorn + Nginx) that receives tasks from Google Cloud Tasks. An example of a task might be "go fetch news about Mastercard". There are various pre-defined tasks available for different entity lists.
The worker checks to see if it has the latest news file for Mastercard. If not, the latest file is downloaded from our Wasabi S3 bucket. Each file is a compressed orjson file to reduce latency. Once refreshed, it executes its task and uploads the result to Wasabi S3 and updates our data version control system.
Fetching news involves two steps. We find new URLs and then we visit each URL and parse the HTML data. Each request is routed through rotating proxies to ensure that we retrieve the page. Particular emphasis is placed on metadata and structured data in the HTML. Pages without SEO data are often rejected.
Similar to Google, we index all data on a regular interval. This involves fetching all the latest news files for all entities and making it searchable. I will talk a little bit more about this indexing process when we introduce the concept of locality sensitive hashing and semantic search further down in this article.
Company Names
How many listed companies are called Discovery? Too many. We have Discovery (DSY) in South Africa, Discovery Silver (DSV) in Canada, Discover Financial (DFS) in the USA, discoverIE (DSCV) in the UK, Warner Bros Discovery (WBD) in the US, Predictive Discovery (PDI) in Australia, and the list goes on and on.
We solved this using a two-stage model. In the first stage we scan the body of each news story for known keywords associated with the overlapping entities. For example, the names of their CEO and board members. This gives us a dataset of stories about each entity that we have high conviction in. For stage one we used the Aho-Corasick algorithm implementation from G-Research.
In the second stage we fit probability models. For example, if we see a story about "Discovery" on latimes.com we know there is a high probability of it being about Warner Bros Discovery. Similarly, if we see an article that mentions South Africa, we know it has a nearly 100% probability of being about Discovery (DSY).
This works most of the time but still makes bloopers. My personal favorite is Hoya Corp (7741) a Japanese eyewear company. As it turns out, professional boxers like Oscar De la Hoya often get hit in the eye and suffer eye injuries. The same kind of eye injuries that Hoya Corp can help with. See the problem? Yes, probabilities can be spurious. The best solution is simply to ensemble.
Inline Headlines
Have you ever noticed how news websites like to show links to other news stories right in the middle of the article you're reading? It's distracting, I know. One early foible was not stripping those sentences out. Not doing this meant that just about every news story ended up being related to Elon Musk and his escapades.

AI-Generated News
The biggest challenge we faced while curating this corpus was AI generated news. At the beginning of 2023 the problem was small. By July we had "crossed the Rubicon" - more AI news was seen per day than real news. In the image below the AI-generated news is indicated by the red bars. Now you see the problem.
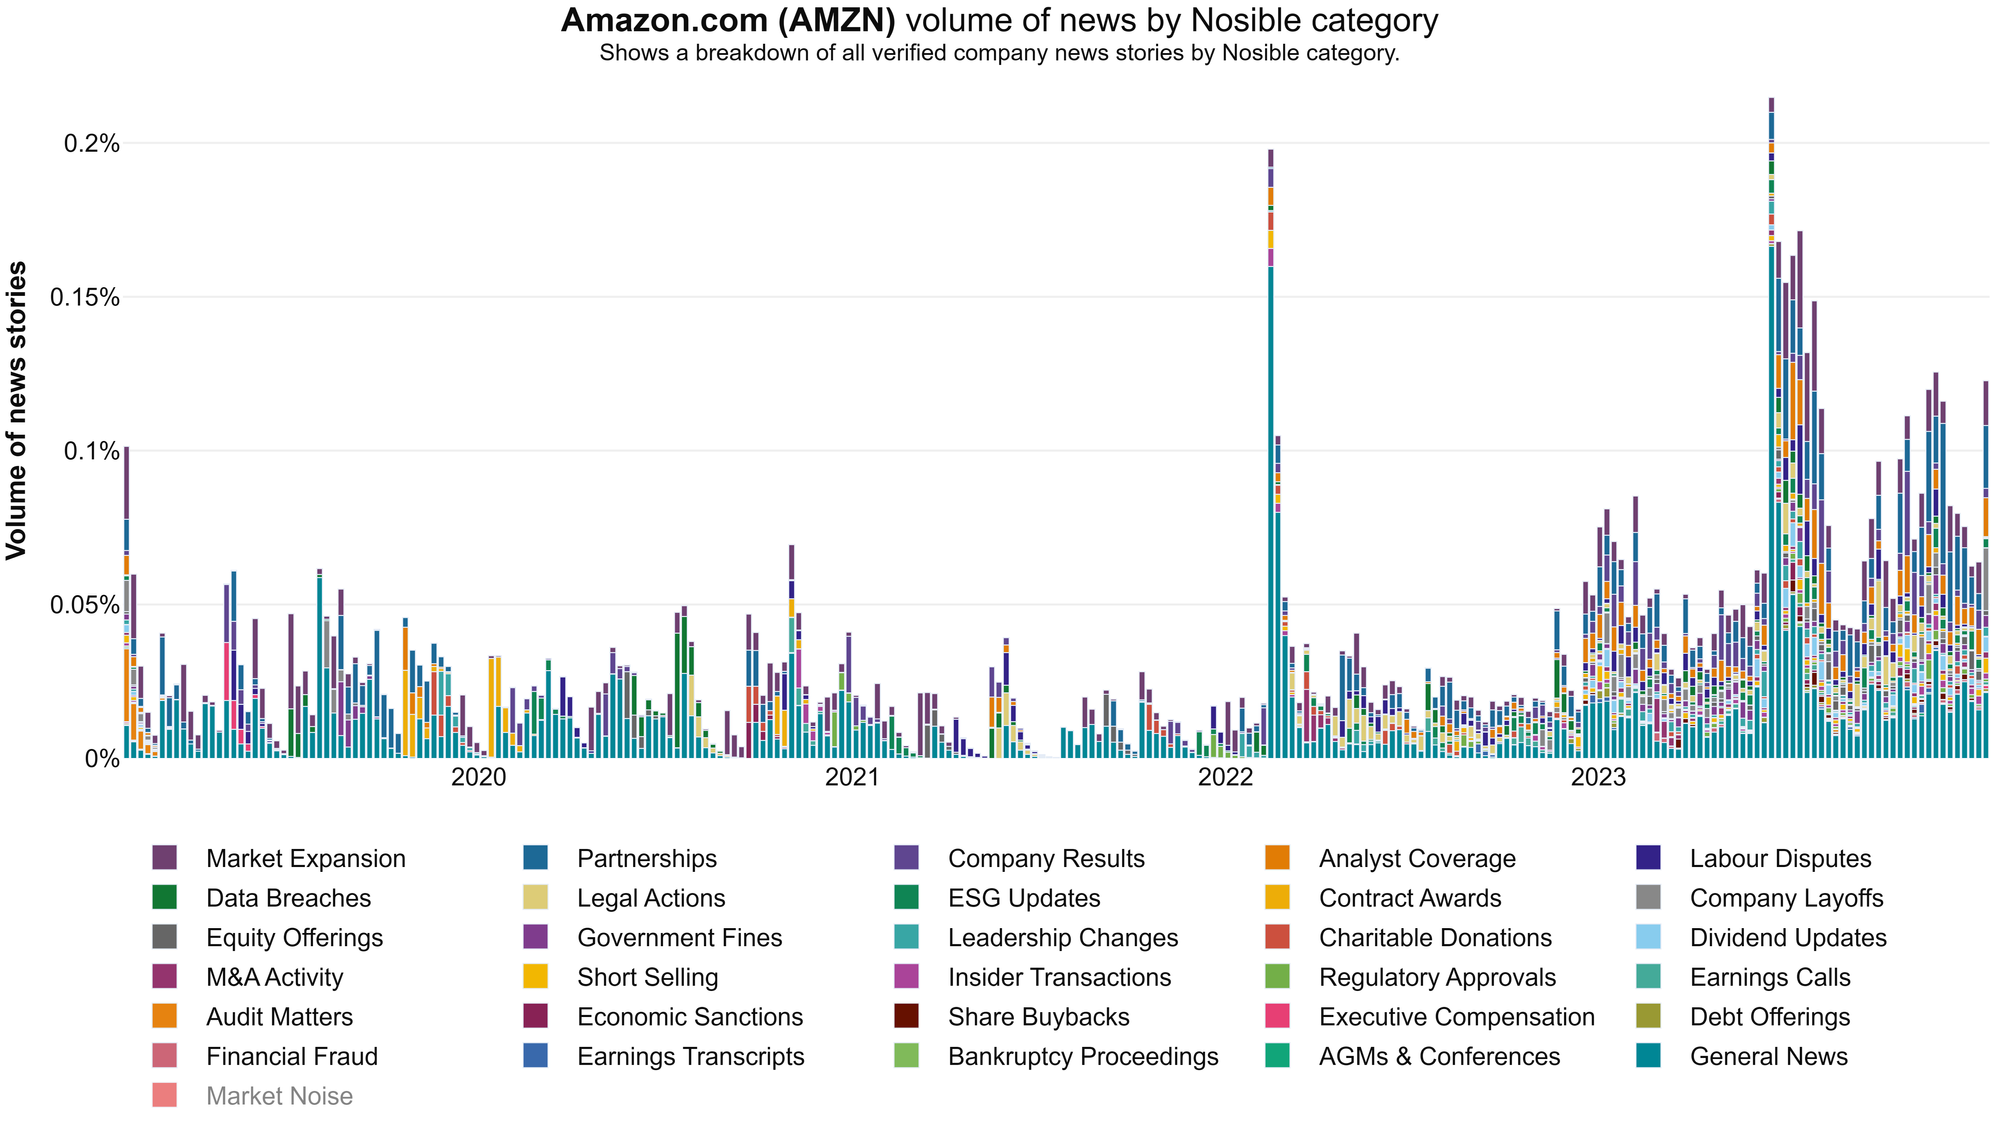
There is a lot to hate about AI generated news. They are usually low-quality knock offs. They don't cite original sources. They are full of inaccuracies and meaningless statements. But worst of all, they break everything. They break search engines, news feeds, social media, public trust, and advertising models.
Worst of all, they break signals extracted from company news! We have found that removing AI-generated news improve the signals we extract a lot.
Identifying AI-generated news at the story level is extremely difficult. In fact, it might not be possible at all. Ultimately what we ended up doing was blacklisting domains that appear to generate repetitive content in high volumes.
To be more specific we look at the distribution of the embeddings of snippets "written" by that domain. If you do that, you'll find that AI-generated sites occupy a relatively small, densely packed region of the vector space when compared to legitimate financial websites such as ft.com, wsj.com and reuters.com.
Our theory is that because the articles are generated from a static prompt plus some dynamic seed content the resulting articles are essentially "constrained" to a small manifold in the vector space. When this metric is combined with a metric of site volume, you get a good predictor. More on this in later blogs.
Curious to see what some of these sites look like? Here you go:
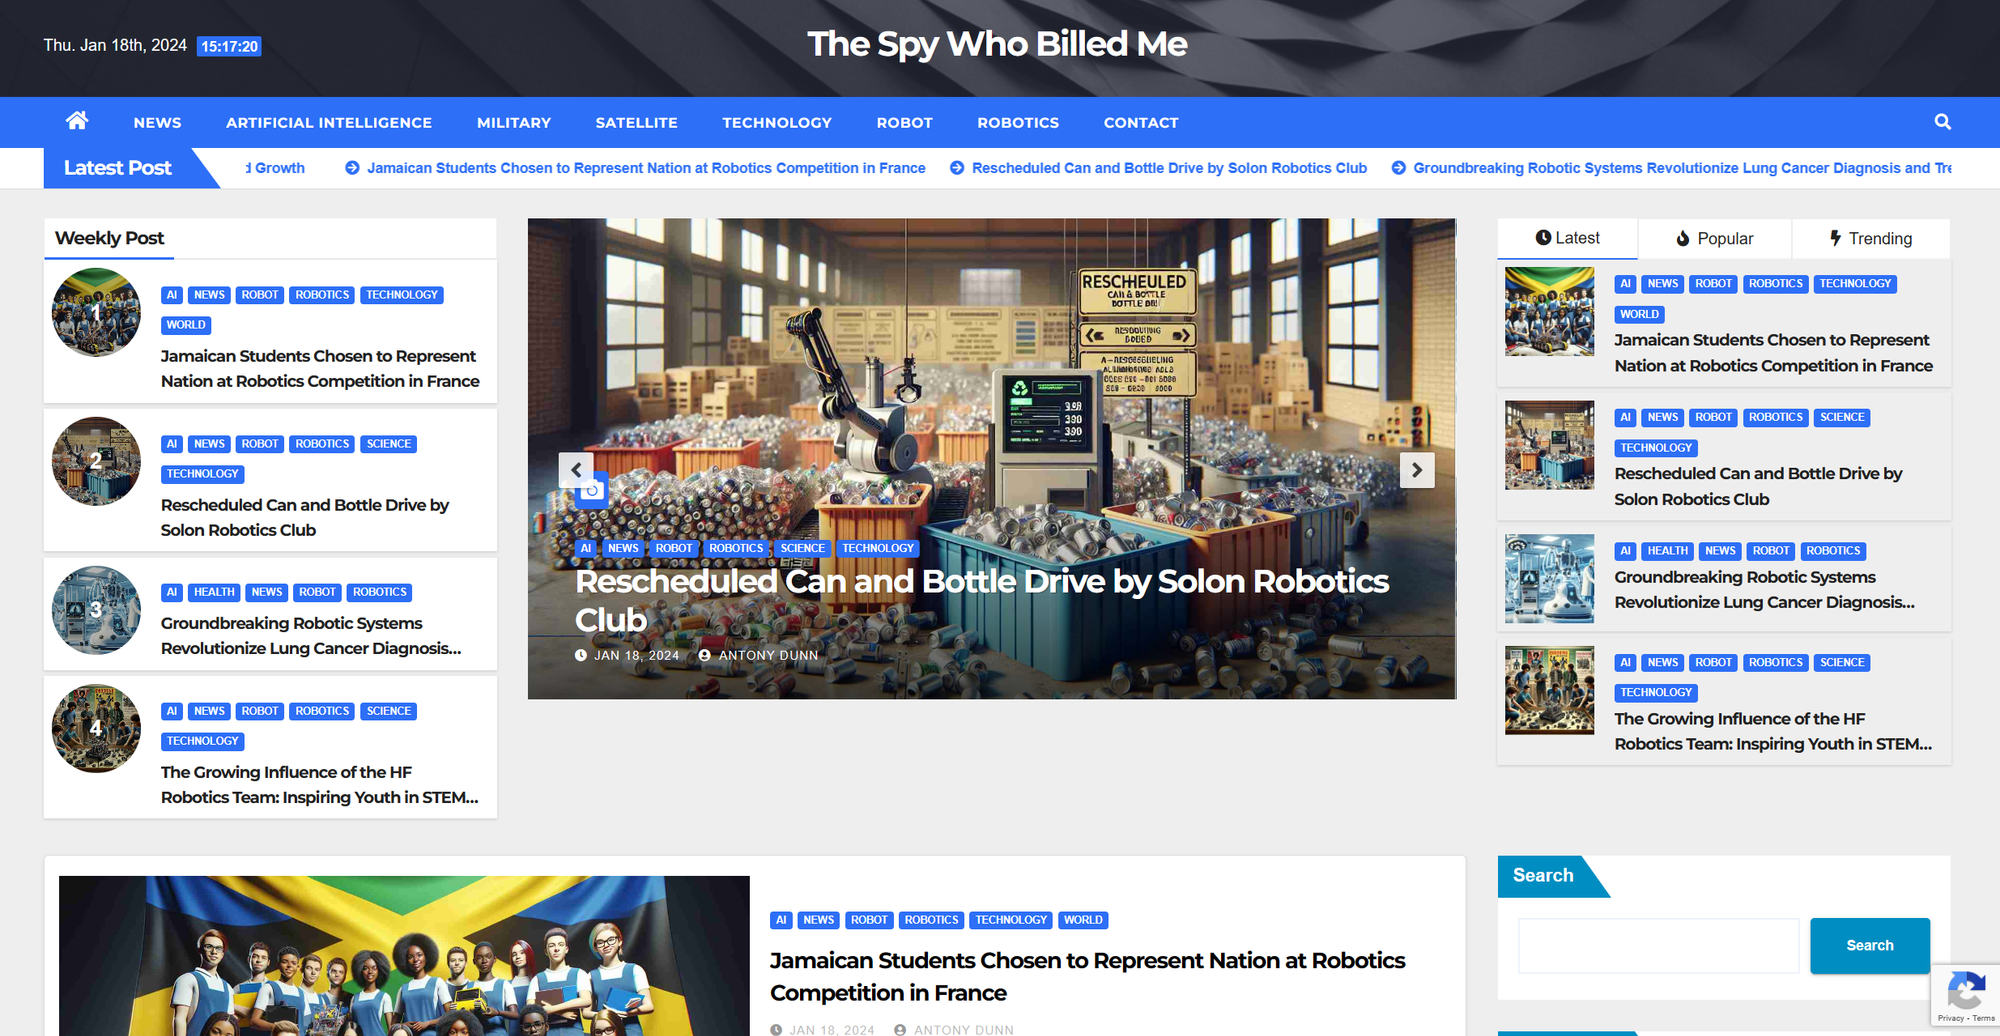
Fortunately, we've noticed two reassuring things when it comes to AI-generated "news" websites. First, quite of few of them have already shut down. I suspect this is because they are operating at a loss. Secondly, we have noticed that Google and Bing are slowly de-indexing these sites from search and news 👏.
Deduplicating News
Deduplicating documents is critical for RAG-based applications. Why? Because if you don't de-duplicate your documents you will end up passing multiple permutations of the same text to your LLM. In our experience, this is a great way to damage precision and recall. It is also wasteful. Every time we create a new index, we de-duplicate all news and find the "apex" story for each cluster.
De-duplication at scale is hard. Using our ultra-optimized LSH index it is possible to search over all 55-million embeddings in <0.20 seconds. Whilst this is extremely fast - about 10x faster than a flat FAISS index - it is not fast enough. Looping from top to bottom and de-duplicating using the top K nearest neighbors would take an unbelievable 11 million seconds. That's 4 months!
Fortunately, we found that duplicate stories are naturally clustered by time and by metadata. Instead of deduplicating across all 55-million embeddings we deduplicate shards of the data that correspond to overlapping periods of time and specific metadata fields. That metadata could be companies, sectors, industries, geographies, or categories. Doing this allows us to deduplicate in minutes.
Semantic Search
In our case, semantic search involves finding the N most similar news snippets to a user's search term from the set of news snippets that match their given filters. Filters in this case may include dates, times, authors, publishers, regions, countries, sectors, industries, stocks, and much more. In order to keep it user friendly, filters are expressed through familiar SQL syntax.
For example, the following filter:
SELECT key FROM engine
WHERE date>='2023-01-01'
AND date<'2024-01-01'
AND apex_story=True
AND sector='Technology'
tells our index to only return de-duplicated news snippets that occur between the first of January 2023 and the first of January 2024 from the technology sector. Of the 55-million embeddings in our corpus, there are 3,692,137 snippets that match this filter. If we wanted to search over the 3,692,137 vectors associated with those matching snippets, we could do it with the following code snippet:
results = esi.search(
    queries=[
        "Adobe Figma Merger"
    ],
    page_index=0,
    page_size=10,
    sql_filter="""
        SELECT key FROM engine
        WHERE date>='2023-01-01'
        AND date<'2024-01-01'
        AND apex_story=True
        AND sector='Technology'
    """,
)
and the search takes 0.28 seconds on my laptop (faster on our server). Where are those 0.28 seconds spent? It is spent on the following steps:
- 0.11 seconds - Execute the SQL query to find the right locations.
- 0.05 seconds - Encode the search term using SBERT (CPU only).
- 0.09 seconds - LSH Search over the 3,692,137 matching vectors.
- 0.02 seconds - Reconstruct the vectors to calculate cosine similarity.
- 0.01 seconds - Compute the cosine similarity of the top N x M results.
Let's take a look at some snippets we got back from our above search!
- "Adobe to terminate \$20 billion Figma buyout because of regulatory pressure. Adobe Inc and design-tools maker Figma said Monday they have agreed to terminate the \$20 billion merger agreement announced 15 months ago ..."
- "Adobe Inc and design-tools maker Figma said Monday they have agreed to terminate the \$20 billion merger agreement announced 15 months ago. Adobe to pay Figma \$1 billion deal-termination fee Adobe and Figma mutually agree to terminate their planned merger amid regulatory pressure ..."
- "Adobe ADBE, +2.47%, the maker of Photoshop, Illustrator and other software tools, and Figma said they still believe in the merits of a merger, but they have mutually agreed that there is no clear path to receive the necessary regulatory approvals from the European Commission and the U.K. Competition and Markets Authority. Adobe disclosed that it will pay Figma \$1 billion ..."
The top three snippets came from the same apex story. Linked to that Apex story there are more than a dozen other stories that cover the same event. If we had left apex_story=True out of our filter we would have near duplicate snippets.
It's worth mentioning that this is a little contrived. Most of the time SQL filters are extremely targeted and much faster. For example, a SQL filter that isolates news snippets linked to Adobe from the past quarter executes in less time.
Locality Sensitive Hashing
Okay but how does this work? Magic! No, not really. It's just stats. The backbone of our index is a technique called locality sensitive hashing (LSH). To put it simply, LSH works by trying to hash similar items to the same hash code(s).
When the order of the elements in a set does not matter and, as a consequence, Jaccard Similarity is a good proxy for similarity, classical LSH algorithms like SimHash, MinHash, and SuperMinHash are useful. A good example of this kind of situation is good old-fashioned bag of words (BOW) models.
Similarly, when the order of the elements in a set matter and, as a consequence, Hamming Similarity is a good proxy for similarity, LSH algorithms designed to preserve angular distances like Random Hyperplanes LSH, Voronoi LSH, Cross Polytope LSH, and Directional Feature Hashing work.
We are already over 2,000 words into this article so I will defer explaining more advanced LSH algorithms to future blog posts. I will, however, introduce the concept of Random Hyperplanes LSH. In my opinion, this is an extremely elegant and versatile little algorithm that everybody should know about.
Having worked in machine learning for a long time I have come to appreciate the power of visual mental models. So let me introduce you to mine ...
Imagine that you and I are floating in zero gravity surrounded by thousands of little water bubbles. They are swirling around us on different arced trajectories at different speeds. This is analogous to a 6-dimensional vector space where we have location, $x$, $y$, and $z$, plus velocity, $v$, acceleration, $a$, and plane, $θ$.
Now let's imagine that I am tasked with guiding you to a small region of bubbles. How would we do that? We could look at every bubble and its neighborhood one at a time. That's brute force search. Or we could play a game of 20 questions. In this game you ask me twenty questions and I answer "yes" or "no".
- "Are the bubbles rotating clockwise?"
- Yes
- "Are the bubbles speeding up?"
- No.
- "Are the bubbles in front of me?"
- No.
- "Are the bubbles underneath me?"
- Yes.
- "Are the bubbles on a plane of 45° or more?"
- No.
And so on and so forth.
With five questions you might already have a decent idea of which bubbles I am referring to. They are behind and underneath you that are rotating clockwise on a plane of more than 45° and are slowing down. More importantly you have a very good idea of which bubbles I am NOT referring to. Rejection matters a lot.
This is obviously just a mental model for playing around with ideas, but in many ways 20 questions describes how and why Random Hyperplanes LSH works.
In Random Hyperplanes LSH we generate a set of random vectors with the same dimensionality as our dataset. These are the hyperplanes, and they are analogous to your 20 questions. Next, we compute the dot product of each vector in our dataset and those hyperplanes and take the signs; + or -, 0 or 1. These bits are analogous to my answers to your 20 questions. These bits ("answers") tell us which vectors lie on which sides of the various hyperplanes. Similar vectors will tend to fall on the same sides of the same hyperplanes. Finally, we can group these bits together to produce integer hashes that encode the location of vectors.
Vectors that produce the same integer hashes are analogous to the bubbles that yield the same answers to your 20 questions. For example, "yes yes no no no yes no yes" → "1 1 0 0 0 1 0 1" -> "197". Just as bubbles that yield the same answers are more likely to be similar, vectors that yield the same integer hashes are more likely to be similar. Using this insight, we can avoid computing cosine similarity on floats and instead compute hamming distances on integers. Because this involves no floating-point operations, most integer operations can be cached, and it is trivial to parallelize, this search can be done extremely quickly on CPUs.
This past year we took this concept to an extreme and are now able to search all vectors at a throughput of over 300 million vectors searched per second.
Signals
Okay, let's recap. We now have a high-quality corpus of de-duplicated snippets of financial news plus the ability to filter it by date, time, sector, industry, region, country, company, etc. and search within those filters quickly using LSH.
So how do we pull out signals? It's quite simple. First, we apply our filter. Second, we search all vectors. And third, turn the results into a visualization. The benefits of using SBERT embeddings and LSH to extract trends are that:
- We can do it on the fly for any word, phrase, sentence, or paragraph.
- It does not require documents to use exact language (keywords).
- With filters we can extract signals from any subset of documents.
- The signal can be computed across 55 million embeddings in <1s.
The Code
Here is the code we used to pull out the verification signals. To extract signals for specific regions, countries, sectors, industries, companies, and categories of news all we need to do is modify the SQL filter that gets applied to the search.
def get_signal(index: EquitySnippetIndex,
               terms: list,
               start: dt.date,
               end: dt.date,
               sql_filter: str,
               name: str,
               triplet=False) -> pd.DataFrame:
    """
    This function accepts a Nosible Snippet index, a list of
    terms to search for, the start date for the signal, the
    end date for the signal, a SQL filter to apply to documents,
    the name of the trend, and whether this is a triplet
    signal. A triplet signal is a special kind of signal that
    uses a baseline, a positive, and a negative term.

    :param index: the Nosible index to search over.
    :param terms: the terms to search for.
    :param start: the start date for the signal.
    :param end: the end date for the signal.
    :param sql_filter: the SQL filter to apply.
    :param triplet: whether this is a triplet signal.
    :param name: the name of the signal.
    :return: a pandas DataFrame with the signal.
    """
    print(f"EXTRACTING '{name}' SIGNAL")

    # Add the dates to the SQL filter.
    sql_filter = f"""
        {sql_filter}
        AND date>='{start.strftime('%Y-%m-%d')}'
        AND date<='{end.strftime('%Y-%m-%d')}'
    """

    # Tidy up the SQL filter so that it prints out nicely.
    sql_filter = " ".join(sql_filter.split())

    # Run the query against the Snippets Polars DataFrame.
    all_locs = index.get_only_use_locs(sql_filter=sql_filter)

    date2total = {}
    for loc in all_locs:
        date = index.loc2monday[loc]
        if date not in date2total:
            date2total[date] = 0
        date2total[date] += 1

    signal_data = {
        monday.strftime("%Y-%m-%d"): {term: 0 for term in terms}
        for monday in pd.date_range(start, end, freq='W-MON')
    }

    for term in terms:

        # Generate an embedding of the trend term using S-BERT.
        vector = index.vectorize_query(query=term).flatten()

        # Start the timer.
        t0 = dt.datetime.utcnow()

        # Get the most semantically similar snippets.
        all_sims = index.full_search(
            vector=vector, locs=all_locs
        )

        # Get the runtime spent in the search method.
        rt = (dt.datetime.utcnow() - t0).total_seconds()

        # Remove all results with too low sims.
        lb = index.max_codes * 0.70
        valid_ixs = np.where(all_sims >= lb)[0]
        all_sims = all_sims[valid_ixs]

        # Compute the distribution and print out what it looks like.
        p20, p40, p60, p80, = np.percentile(a=all_sims, q=[20, 40, 60, 80])

        for loc, sim in zip(valid_ixs, all_sims):

            date = index.loc2monday[loc]
            max_score = date2total[date] * 8

            if sim >= p80:
                signal_data[date][term] += 8 / max_score
            elif sim >= p60:
                signal_data[date][term] += 4 / max_score
            elif sim >= p40:
                signal_data[date][term] += 2 / max_score
            elif sim >= p20:
                signal_data[date][term] += 1 / max_score

    signal_df = pd.DataFrame.from_dict(signal_data, orient="index")

    if triplet is False:
        return signal_df

    else:
        # The first signal is the baseline signal.
        baseline = signal_df[terms[0]]
        baseline_sma = baseline.rolling(window=4).mean()
        baseline_mu = baseline.rolling(window=26).mean()
        baseline_sd = baseline.rolling(window=26).std()
        baseline = (baseline_sma - baseline_mu) / baseline_sd

        # The second signal is the positive signal.
        positive = signal_df[terms[1]]
        positive_sma = positive.rolling(window=4).mean()
        positive_mu = positive.rolling(window=26).mean()
        positive_sd = positive.rolling(window=26).std()
        positive = (positive_sma - positive_mu) / positive_sd

        # The third signal is the negative signal.
        negative = signal_df[terms[2]]
        negative_sma = negative.rolling(window=4).mean()
        negative_mu = negative.rolling(window=26).mean()
        negative_sd = negative.rolling(window=26).std()
        negative = (negative_sma - negative_mu) / negative_sd

        # Calculate the true signal by looking at the differences.
        true_signal = pd.DataFrame(columns=[name], index=signal_df.index)
        true_signal[name] = (positive - baseline) - (negative - baseline)

        return true_signal
Validation Signals
In order to verify that the trend system is working as expected let's pull out some signals where we think we know what the signal should look like:
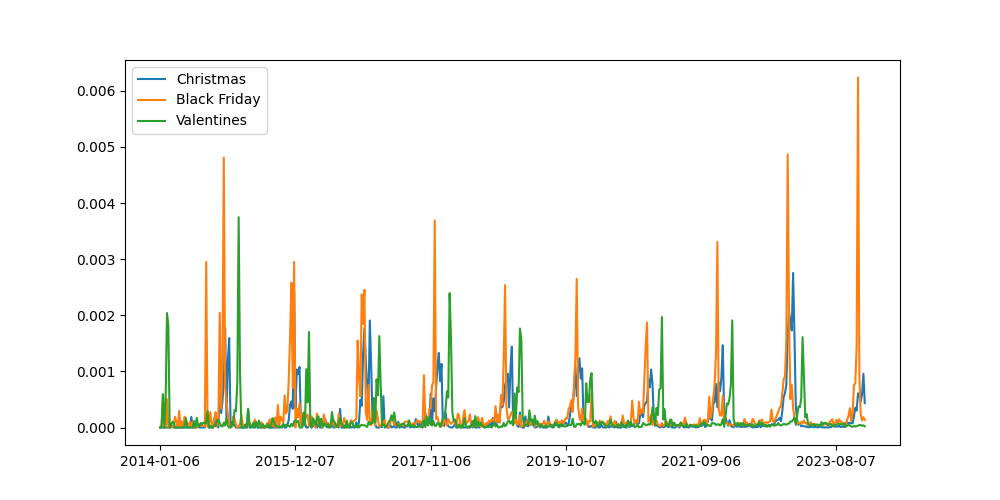
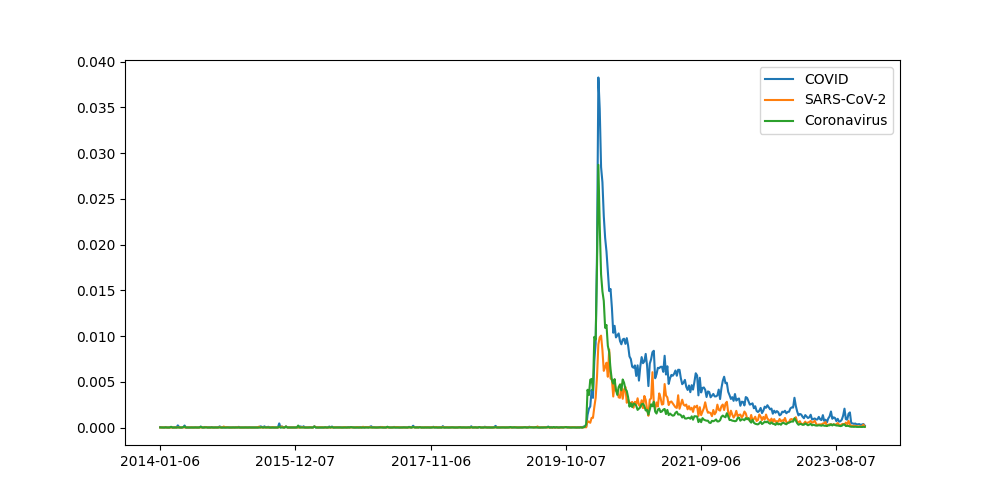
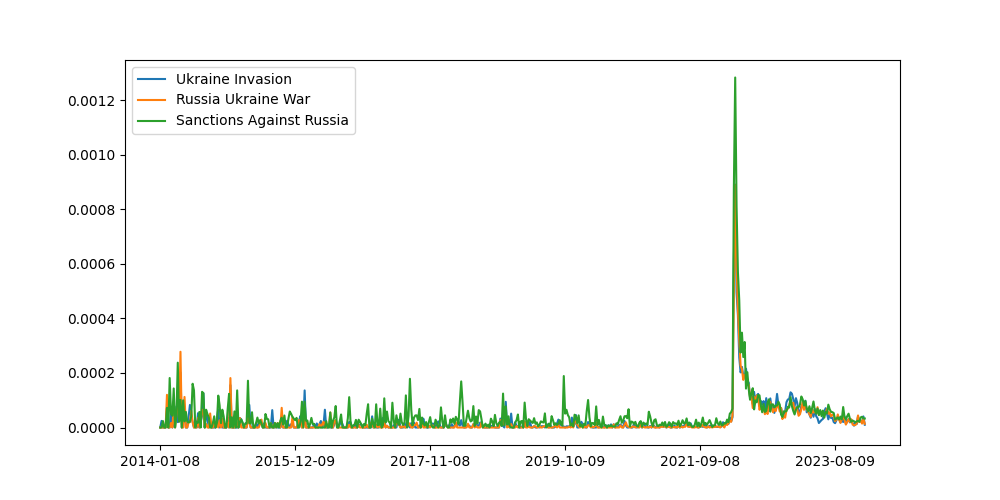
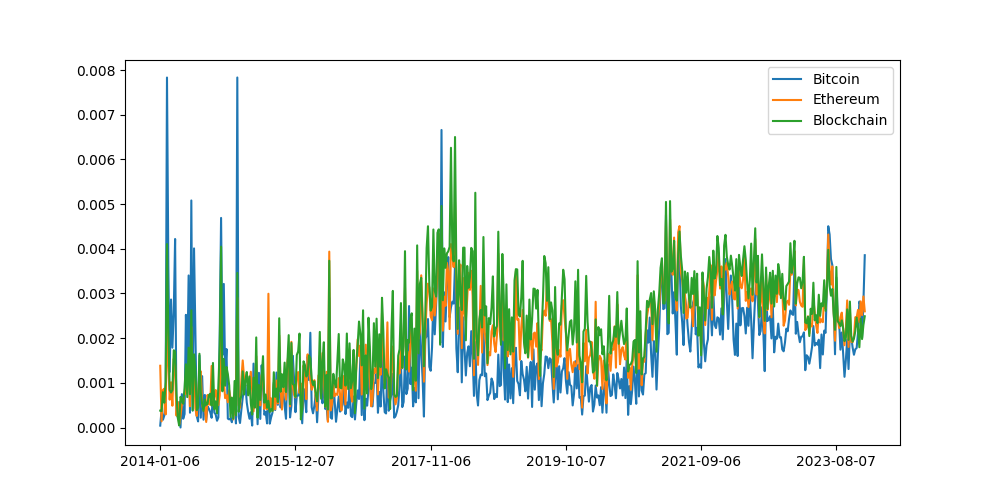
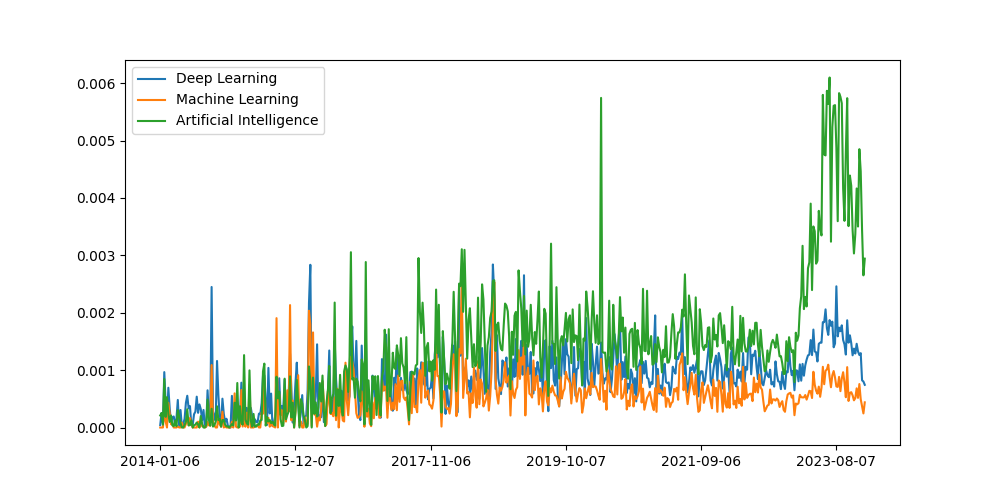
Great, it looks like the system is working because the validation signals look like what we would expect them to look like. This is very reassuring.
Market Signals
Whilst playing with this data I wondered to myself whether it would be possible to create new indicators that can tell us how companies in the global economy are performing. As it turns out, we can but it was tricky for three reasons.
Firstly, off-the-shelf embedding models are not discriminative enough. To show you what I mean, let's consider the following pair of sentences:
- The company beat analyst estimates.
- The company missed analyst estimates.
To a human investor these two sentences have very different meanings. To us their semantic similarity is negative. However, to off the shelf embedding models trained on general corpora these sentences look almost exactly the same.
Secondly, there is a lot of cyclicality in text that relates to company performance. For example, when you look at the trend of snippets that relate to "beat analyst estimates" you can clearly see when we are in earnings seasons or not.
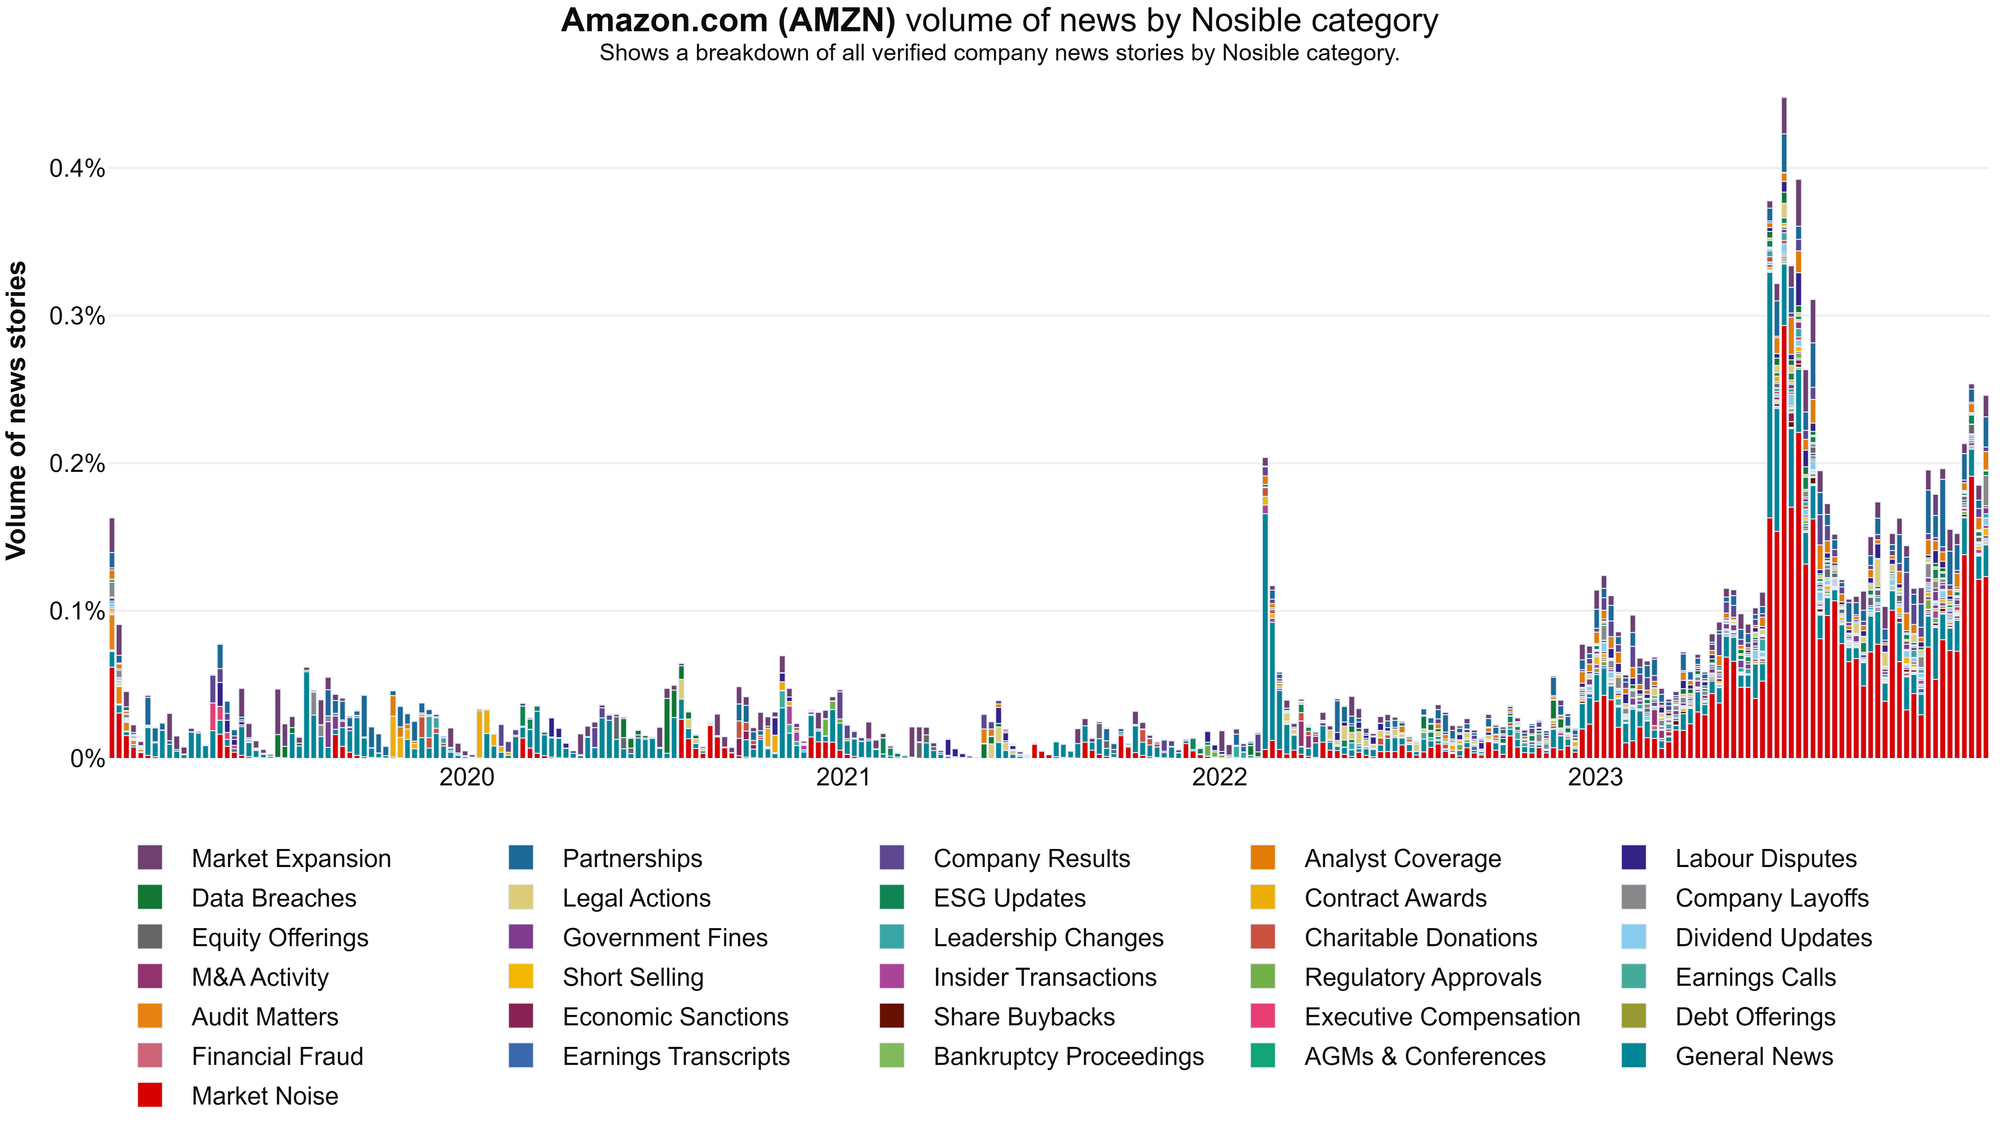
And, thirdly, not only has the volume of company results news increased, but the proportion of company results news has also increased. This lends credibility to the view that investors and journalists are increasingly myopic.
Here's a chart that shows you what I mean:
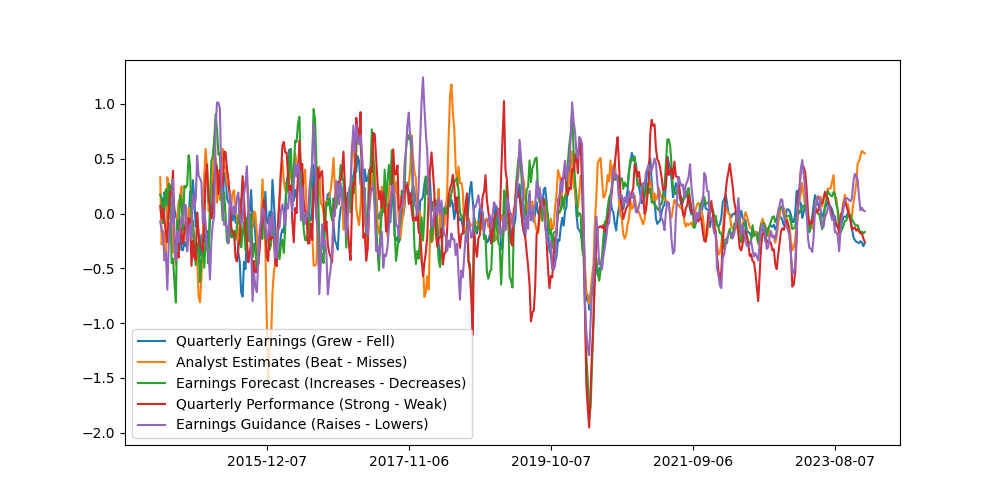
Nevertheless, using some time series analysis we can still extract a signal. The procedure we used to extract our market barometer signal is as follows:
- Extract three signals using (1) a baseline term, (2) a positive term, and (3) a negative term. Here are the triplets we considered:
- Baseline: "Quarterly Earnings"
- Positive: "Quarterly Earnings Grew"
- Negative: "Quarterly Earnings Fell"
- Baseline: "Analyst Estimates"
- Positive: "Beats Analyst Estimates"
- Negative: "Misses Analyst Estimates"
- Baseline: "Earnings Forecast"
- Positive: "Increases Earnings Forecast"
- Negative: "Decreases Earnings Forecast"
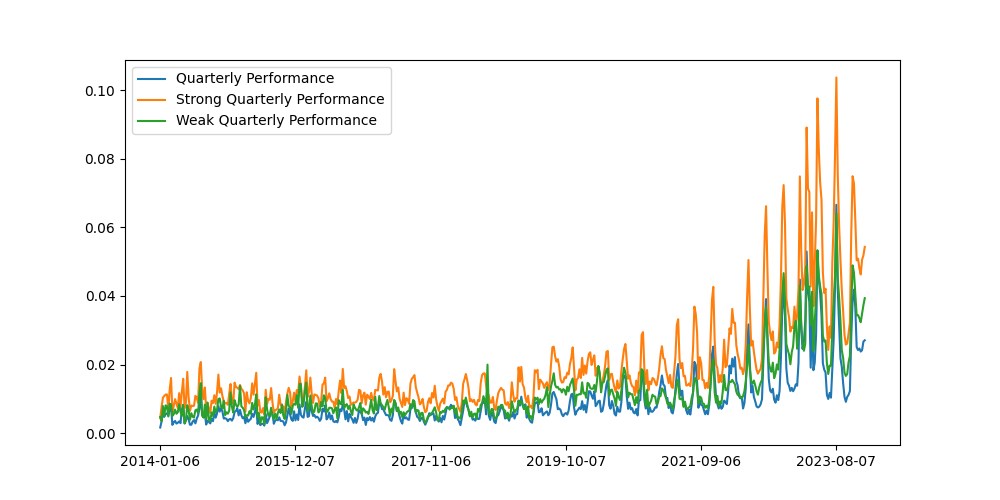
- Baseline: "Quarterly Performance"
- Positive: "Strong Quarterly Performance"
- Negative: "Weak Quarterly Performance"
- Baseline: "Earnings Guidance"
- Positive: "Raises Earnings Guidance"
- Negative: "Lowers Earnings Guidance"
- Calculate a rolling Z-score for each of the three terms by subtracting the rolling 6-month average and dividing by the rolling 6-month standard deviation.
- Then calculate the investment signal as (Positive Z-score - Baseline Z-score) - (Negative Z-score - Baseline Z-score) to get a market indicator.
Here we can see the results from 2014-01-01 to the time of writing:
And here is what the signal looks like when we take the sum across each of the constituents. Taking the sum makes it easier to see the overall trend.
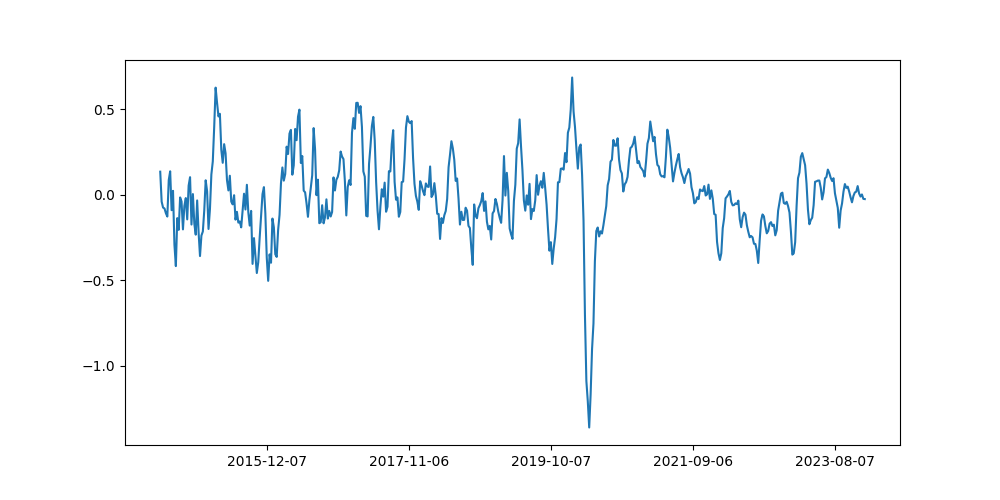
We are currently evaluating these signals and will follow up this blog post with the results. In our evaluation we are looking at how consistent these signals are with existing indicators of economic health. We are also looking at whether the signals are leading or lagging and whether filters can improve them.
Applications
We are also working with one of our enterprise customers, Sentio Capital, to build strategies that leverage our news corpus. We are looking at how signals can be incorporated into risk models. We are also looking at sentiment because it would be nice to split signals up using SQL filters such as the one below:
# Look at the signal coming from only positive documents.
SELECT key FROM engine WHERE sentiment='Positive'

# Look at the signal coming from only negative documents.
SELECT key FROM engine WHERE sentiment='Negative'
And we are working closely with Fundamental Group, an asset management media buying and planning company and partner in Nosible. We are using signals to understand what the media is talking about and where that conversation is happening. This data is useful for semantic advertising.
# Look at the signal coming from only Reuters.com.
SELECT key FROM engine WHERE source='reuters.com'

# Look at the signal coming from only FT.com and WSJ.com.
SELECT key FROM engine WHERE source in ('ft.com', 'wsj.com')
It also goes without saying that we are planning on adding this capability to our core product in a number of ways. One idea is to provide an LLM context about a company and prompt it to think of signals that may affect it. We could then pull those signals into the platform for users to see and download.
Next Steps
First and foremost, we need to add more data. If you look closely at the holidays signal you will see that the signal gets more refined as time goes by. Unlike some systems, what we have gets better as we add more data. So that is what we plan to do. Hence our 2024 goal: push this concept to internet-scale datasets.
Secondly, we need to add more diverse data. The language used in SEC filings is different to the language used by journalists in news stories intended to have mainstream appeal. In order to extract signals of more nuanced events that affect companies we must ingest formal text from SEC filings and court cases.
Thirdly, we need to train better encoders. Our research has shown that even the best off-the-shelf encoders are not nuanced enough for financial documents. Fortunately, we can use our index to bootstrap a high-quality dataset that we can use to finetune nuanced encoders optimized for financial documents.
And that's all folks. If you've stuck with us all the way to the very end, kudos. As I mentioned, we are building in public this year so if you liked this content and would like to see more of it, sign up to receive email updates when we blog or follow us on twitter. If you want to talk, I'm at stuart@nosible.com.